In my view, the problem is not so much with their observation (equation denser papers tend to collect fewer citations) as with their main conclusion:

"To maximize the scientific impact of their work, biologists should consider reducing the equation density in the main text of their theoretical articles."

These type of observational analyses (i.e. *not* randomised experiments) are prone to confounding factors---a problem I am keenly aware of, as it almost ruined two years of my work.

Although the authors have controlled for a few confounders (article length, journal), there could well be other important ones.

For instance, it is well known that math papers have in general much lower citation rates than biological papers. So it might well be that articles on more mathematical topics tend to get fewer citations in general---regardless of the number of equation.

Because of this, I'd caution against dropping equations in the hope of boosting one's citation count.

For what it's worth, my own anecdotal experience has been that math formulas can be appreciated if they are accompanied by intuitive explanations about their rationals. Ideally, the text should make sense to both mathphobes skipping over the equations and mathphiles skipping over prose!


Thanks to Hannes Röst for bringing this article to my attention.


Reference:

Fawcett TW, & Higginson AD (2012). Heavy use of equations impedes communication among biologists. Proceedings of the National Academy of Sciences of the United States of America PMID: 22733777

sciseekclaimtoken-4ffddb9030141

We have been fortunate to publish two articles in last month's PLoS Computational Biology. The first one was on resolving the ortholog conjecture, and I have written about it at length in a guest post on Jonathan Eisen's blog.

This post focuses on the second paper, "Quality of Computationally Inferred Gene Ontology Annotations". Stimulated by Jonathan's story behind the paper series, I am going to try to put this work too in perspective.


The dilemma about computationally inferred function annotation

The Gene Ontology initative is the standard for protein function annotation. For 2011 alone, Google Scholar finds almost 10,000 scientific articles with the keyword "Gene Ontology".

The trouble is that we know little about the quality of these annotations, especially the >98% inferred computationally. The community perceives them as unreliable--at best suited for relatively coarse exploratory analyses, such as term enrichment analyses (and even those are not without risks).

At the same time, virtually everything we know about the function of genes in non-model organisms is based on computational function inference.


Our approach: verify old, computationally-inferred annotations using new experimentally established annotations

Nives Škunca, first author of our study, came up with the fundamental idea: to use experimentally-backed annotations, considered the gold standard, to verify computational ("electronic") annotations. And to avoid circularity, we made sure to only use experimental annotations added to the GO database (UniProt-GOA, to be precise) after the computational annotations under evaluation.

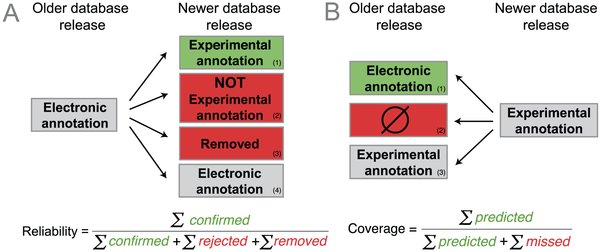
Based on this idea, we defined the average reliability of a GO term as the proportion of electronic terms in an older database release confirmed by new experimental annotations in a subsequent release (see figure below). Hence, every time a new experimental annotation confirms an electronic prediction, the reliability of the corresponding term increases. Conversely, every time a new experimental annotation contradicts an electronic annotation or, more subtly, every time an electronic annotation is subsequently removed from the database, the reliability of that term decreases. Our reliability measures attempts to capture the machine learning notion of precision.

 
fig2.png
Outline of strategy (figure 2 of the paper


To capture the machine learning notion of recall, we defined the coverage measure, the fraction of new experimental annotations computationally predicted (see figure above). For instance, a high coverage means that most new experimental annotation has been previously predicted as electronic annotation.


Reliability measure: not as straightforward as it might seem

At first sight, these definitions might seem quite mundane. But let's have a closer look at the reliability measure, which proved to be much more tricky--even contentious, see next section--to devise than we had anticipated.

The big complication is due to the "open world assumption" of GO--the notion that GO annotations are incomplete, and thus "absence of an annotation does not imply absence of a function". And because genes can have multiple annotations, even the minority of genes that are experimentally annotated cannot be considered as complete.

The open world assumption makes it difficult to falsify predictions. Consider a computational prediction assigning function x to a certain gene. If an experiment later demonstrates that this gene has function y, this does not imply that the original prediction was wrong. What we need to falsify the prediction is an experiment that demonstrates that gene does not have function x.

Such "negative results" can be captured in GO annotations using the NOT qualifier. But a search on EBI QuickGO reveals that <1% of current experimental annotations are negative annotations. In part, this state of affairs is a consequence of the general bias against negative results in the literature. Also, it is harder to make definitive statements about absence of function than about presence of function, as absence must be ascertained under all relevant conditions.

The GO consortium has recognised the need for more negative experimental annotations, but it will take a while before the current imbalance significantly changes. Meanwhile, we felt that we needed an additional way of identifying poor annotations.


Reliability measure: penalising removed annotations

If you recall our definitions above, we include in the reliability measure a penalty for electronic annotations that are subsequently removed from the database (an annotation present in release n has disappeared in release n+1).

However, electronic annotations can disappear for reasons other than being wrong. As Emily Dimmer and colleagues from UniProt-GOA pointed out to us, removals can reflect tightening standards (e.g. by setting more conservative inference thresholds), responses to changes in the GO structure, or temporary omissions due to technical problems (e.g. integration failure from external resources).

Nevertheless, we reasoned that from the standpoint of a user, removed annotations do not inspire confidence and whatever the reason may be, removed annotations can hardly be considered "reliable".

This discussion also highlights the importance of finding an appropriate name. Because a removal does not necessarily implies an error, calling our measure "correctness" or "accuracy" would have been too strong. Conversely, calling our measure "stability" would also not have been appropriate, as it goes beyond mere stability: electronic annotations that are left unchanged do not increase the reliability ratio of a term; only experimental confirmation does.


What we found

One main finding of our study is that electronic annotations have significantly improved in recent years. A way of seeing this is to look at the following interactive motion plot (click on image to load the flash app):

  motion-chart.png
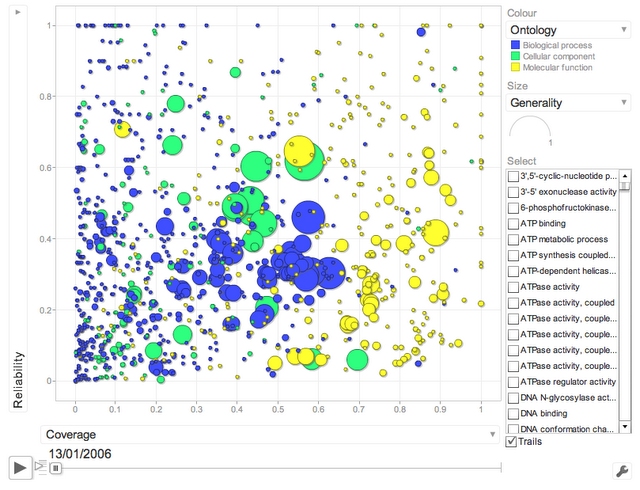
(click on image to load the flash applet)


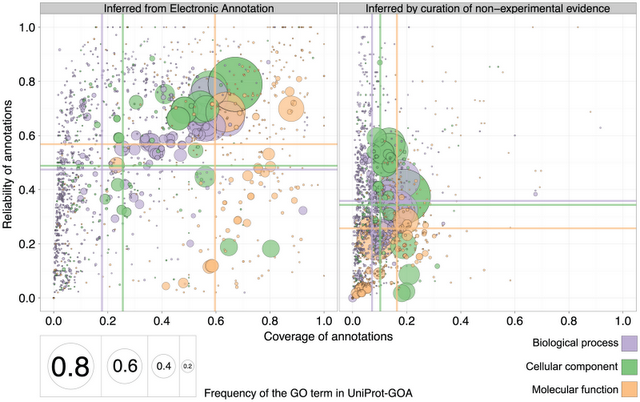
Better yet, we also observed that the reliability of electronic annotations is even higher than that of annotations inferred by curators (i.e. when they use evidence other than experiments from primary literature):


fig8.png
Comparison of reliability and coverage for electronic annotation on the left
and curated annotations on the right (figure 8 of the paper


What next?

I am glad that the work has been picked up by Iddo Friedberg on his blog (see also the associated discussion on Slashdot). I'll answer some of Iddo's questions in the comment section of his blog.

Looking forward, we view this work as an essential step toward our long-term aim of improving computational function inference. Indeed, one thing that seems to often hold in computational biology is that there is no point coming up with a faster or more clever algorithm as long as one has not identified a dependable objective function (or assessment strategy), such as the quality measures introduced here. As late management-guru Peter Drucker said, "there is nothing so useless as doing efficiently that which should not be done at all". 


More info: Here's a link to the paper and a link to the supplementary figures. If you are interested in further developments, you can follow me on Twitter at @cdessimoz.


Reference:
Skunca Nives, Altenhoff Adrian, & Dessimoz Christophe (2012). Quality of computationally inferred gene ontology annotations. PLoS computational biology, 8 (5) PMID: 22693439
In case you have missed it, a few weeks ago, I wrote a guest post on Jonathan Eisen's blog on resolving the ortholog conjecture:

http://phylogenomics.blogspot.co.uk/2012/05/story-behind-paper-guest-post-on.html

If you have any comment, please leave them over there!

Blog Revival

| | Comments (0)
I am reviving this blog!

Expect at least a few posts...

Insightful Visualization of Bioinformatics Data

| | Comments (0)

Bioinformatics analyses often consists in looking for interesting signals in large amounts of data. But in my current work environment (Darwin scripts with occasional gnuplot and R plots), I find it both conceptually difficult and practically tedious to produce insightful visual representation of my data. There are large scientific benefits in finding new visual representation of bioinformatics data, and in simplifying the process of data exploration in general.

This is not to say that there are no such examples. In fact, some excellent representation exist, and tools to easily produce them have been developed. I am listing a few of them on top of my head here as inspiration and starting point for future ideas:

Sequence logo

Sequence logos, introduced in 1990 by Schneider and Stephens, are very clever way of displaying consensus sequences. To take a classical example, the promoter sequence of many eukaryotic genes contain a TATA-box, the perhaps best known transcription factor recognition site:

tata-logo
(source http://www.cbs.dtu.dk/staff/dave/roanoke/genetics980320f.htm)


The height of a character depicts its degree of conservation in bits of information. This metric make sense because it is related to the thermodynamic energy. More importantly perhaps from the visual point of view, the logarithmic nature of bits makes strongly conserved characters stick much higher than they would if their height was proportional to the probability. As a result, the figure resolutely concentrates on signal, and wastes no space on noise!


Circular Phylogenetic Trees

Visualizing phylogetic tree of life using traditional representations becomes difficult for more than about 100 leaves. The circular tree representation has been popularized by iTol from Letunic and Bork:


(source: Wikipedia)


The downside of this representation is that since all leaves are distributed at constant angular intervals, closely related leaves can be far apart, while distant leaves can be adjacent. This problem is partly mitigated by changes in label color, but this can only be effective for the top few levels. 


Circos - Genome visualization

The following page shows stunning genome visualization, also based on the idea of a circular representation. 

Circos

Circos: visualizing the genome, among other things

Be sure to have a look at their poster too...


Visual Complexity

The Visual Complexity page is a repertoire of complex representations of networks, and include a number of examples from biology:

Visual Complexity.png

(source: http://www.visualcomplexity.com/vc/)

References

T. D. Schneider and R. M. Stephens, Sequence Logos: A New Way to Display Consensus Sequences (1990) Nucl. Acids Res. 18: 6097-6100,

Letunic and Bork, Interactive Tree Of Life (iTOL): an online tool for phylogenetic tree display and annotation (2006) Bioinformatics 23(1):127-8

First post

| | Comments (0)
Welcome to my blog! 

In this space dedicated to bioinformatics research, I will discuss projects and articles that I find interesting and will occasionally report about my own research.

And perhaps some day, if I ever have any readers, this place will be the ground for some exciting conversations....

Christophe